Cyclistic
I am a junior data analyst working in the marketing analyst team at Cyclistic (a fictional bike-share company in Chicago). The director of marketing believes the company’s future success depends on maximizing the number of annual memberships. Therefore, my team wants to understand how casual riders and annual members use Cyclistic bikes differently. From these insights, my team will design a new marketing strategy to convert casual riders into annual members. But first, Cyclistic executives must approve my recommendations, so they must be backed up with compelling data insights and professional data visualizations.

The Challenge
In 2016, Cyclistic launched a successful bike-share offering. Since then, the program has grown to a fleet of 5,824 bicycles that
are geotracked and locked into a network of 692 stations across Chicago. The bikes can be unlocked from one station and
returned to any other station in the system anytime.
Until now, Cyclistic’s marketing strategy relied on building general awareness and appealing to broad consumer segments.
One approach that helped make these things possible was the flexibility of its pricing plans: single-ride passes, full-day passes,
and annual memberships. Customers who purchase single-ride or full-day passes are referred to as casual riders. Customers
who purchase annual memberships are Cyclistic members.
Cyclistic’s finance analysts have concluded that annual members are much more profitable than casual riders. Although the
pricing flexibility helps Cyclistic attract more customers, Moreno, my manager believes that maximizing the number of annual members will
be key to future growth.
Rather than creating a marketing campaign that targets all-new customers, Moreno believes there is a
very good chance to convert casual riders into members. She notes that casual riders are already aware of the Cyclistic
program and have chosen Cyclistic for their mobility needs.
The Data Analysis Process.

Identifying The Business Task
The three questions we asked to guide the future marketing program are:
- How do annual members and casual riders use Cyclistic bikes differently?
- Why would casual riders buy Cyclistic annual memberships?
- How can Cyclistic use digital media to influence casual riders to become members?
The business task is to design marketing strategies aimed at converting casual riders into annual members. In order to do that, however, the marketing analyst team needs to better understand how annual members and casual riders differ, why casual riders would buy a membership, and how digital media could affect their marketing tactics. Moreno assigned me the first question to answer: How do annual members and casual riders use Cyclistic bikes differently?
Preparing The Data
I used Cyclistic’s historical trip data to analyze and identify trends. (Cyclistic trip data). This is the public data that I used to explore how different customer types are using Cyclistic bikes. The table conists of 13 fields with around 755,552 records.
But note that data-privacy issues prohibit me from using riders’ personally identifiable information. This means that I won’t be able to connect pass purchases to credit card numbers to determine if casual riders live in the Cyclistic service area or if they have purchased multiple single passes.
Processing The Data
Based on the question in the ask phase, I decided on the data I would use and the fields that were important for the task. I dropped the start_station and end_station names together with their Ids since there were a lot of missing values. This didn't affect the quality of the data since this information can be readily referenced from the latitude fields(start_lng, start_lat, end_lng, end_lat)
- I converted the time data fields to datetime data type.
- I calculated for the ride length by finding the difference between the ended_at and started_at time period for each observation.
- I dropped all observations with null end_lat and end_lng.
- I converted the ride_length field to minutes.
- I extracted the day of week from the datetime field. This will help me visualize weekly trends in our analysis later on.
Analyzing The Data
Now it's time to gain insights from our data using inferential statistics and data visualizations.
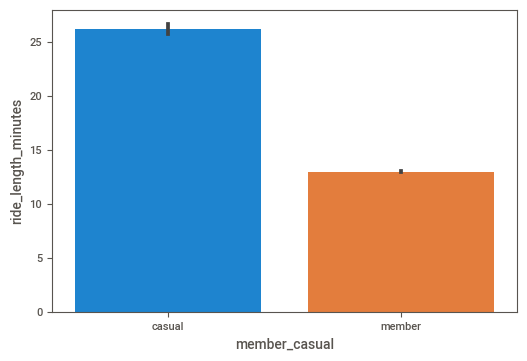
I observed that casual members had longer rides than annual members. This is not suprising since there are more casual members than annual members.
Breaking down Fig1. reveals another important insight: Casual members have longer rides in minutes with classic bikes than with their electric counterparts.
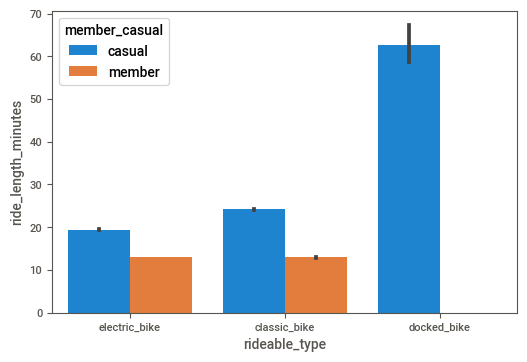
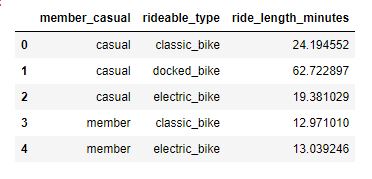
The above claim is further reinforced with the table below. This goes on to show that casual members are keen on using classic bikes, with annual members mostly using electric bikes
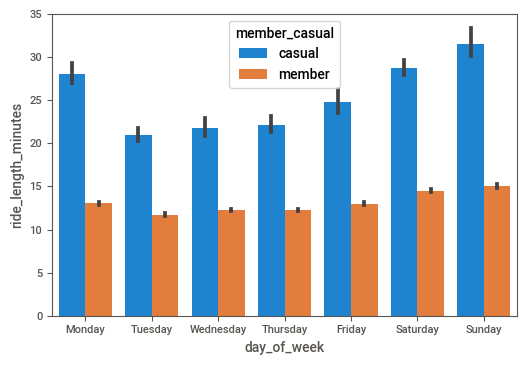
Zooming in, we can see that bike usage for both members and casual riders gradually rise during the weekends. This may indicate that casual riders are inclined to using bikes for leisure purposes whilst members use them for commute.
Share
Now we’re ready to use these insights to make recommendations for the marketing team.
- Casual riders mostly use bike-sharing for leisure and tourism purposes and are highly active on weekends;
- Annual members use bike-sharing to commute to work during the week and are more active on weekdays.
Recommendation
Please create new membership offers focused on weekend rides, family subscriptions (since families tend to spend their weekends together), or offers created in collaboration with public institutions like museums/theatres and other institutions where casual riders travel the most.